Key pieces, themes, colors, prints and fabrics from every runway, ranked by share of looks and compared with the same season a year earlier. A new season is added as its catwalk shows are analyzed.
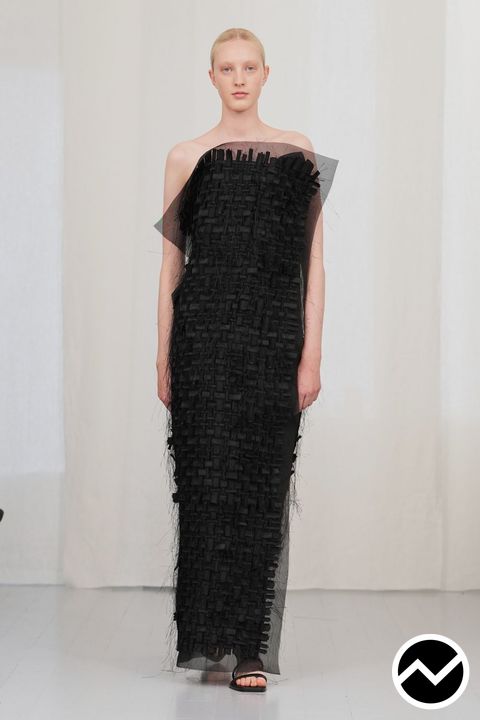
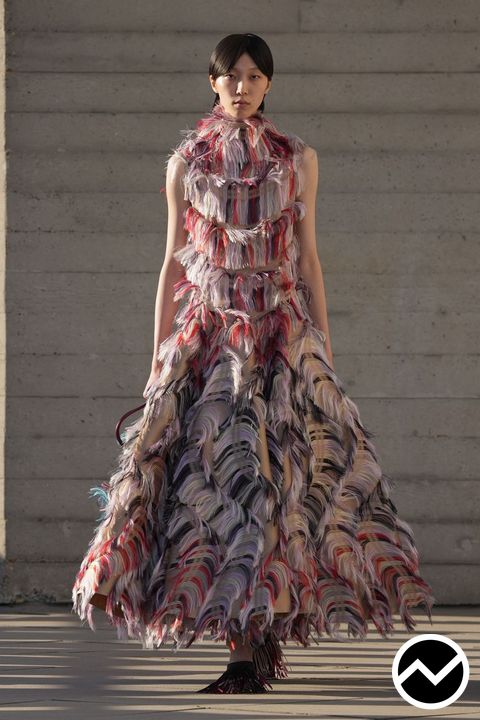


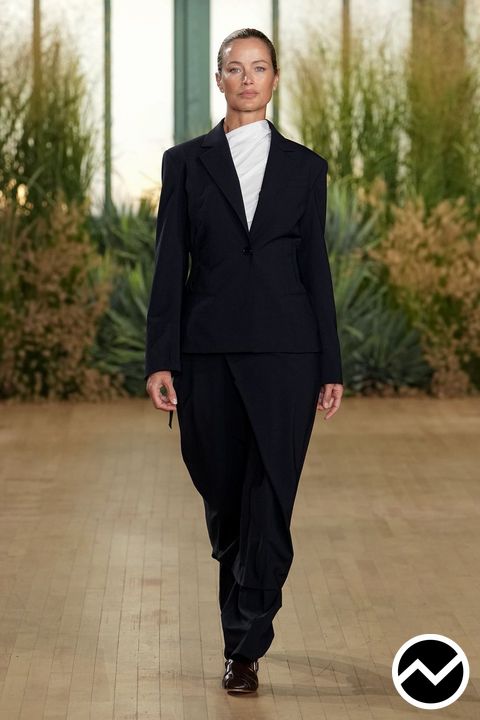
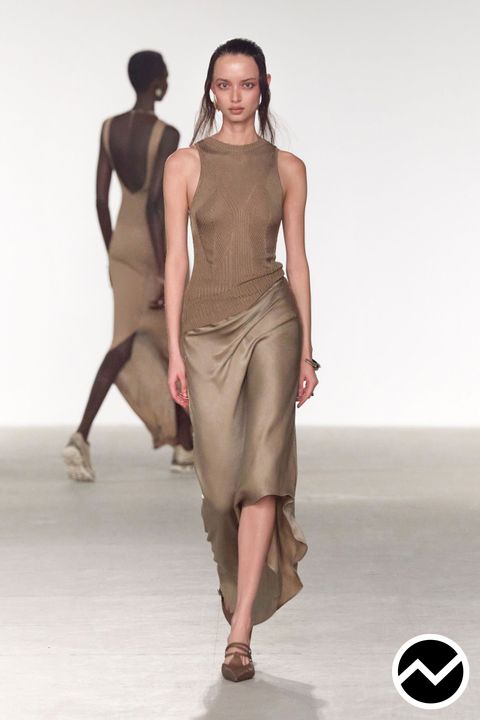
Spring/Summer 2027
14 fashion week scopes so far, updated October 18, 2026.
| Fashion week | Colors | Trends | Biggest riser |
|---|---|---|---|
| All cities womenswear | 317 | Straight Skirts 5.1% → 10.3% | |
| Paris womenswear | 216 | Straight Skirts 5.2% → 10.6% | |
| New York womenswear | 193 | Straight Skirts 4.0% → 11.3% | |
| Milan womenswear | 148 | Sleeveless Top 8.8% → 14.9% | |
| London womenswear | 115 | Dropped Dress 1.0% → 8.2% | |
| Copenhagen womenswear | 55 | Floral 11.3% → 19.1% | |
| Tokyo womenswear | 32 | Drop Shoulder Jacket 1.9% → 11.3% | |
| Shanghai womenswear | 8 | Satin 23.3% → 42.2% | |
| All cities menswear | 220 | Drop Shoulder Jacket 4.3% → 11.6% | |
| Paris menswear | 135 | Minimalist 14.9% → 23.9% | |
| Milan menswear | 95 | High-Rise Pants 9.9% → 20.2% | |
| London menswear | 45 | Hip Length Shirts 14.3% → 27.1% | |
| New York menswear | 45 | Androgynous 15.4% → 29.7% | |
| Tokyo menswear | 26 | Drop Shoulder Jacket 1.4% → 18.4% |
Earlier seasons
Womenswear across all cities, each season compared with the same season a year before.
| Season | Fashion weeks | Trends | Biggest riser |
|---|---|---|---|
| Fall/Winter 2026 | 5 | 156 | Tailored Pants 19.1% → 22.3% |
| Spring/Summer 2026 | 4 | 226 | Charcoal 3.2% → 6.9% |
Biggest risers in SS27
Largest gain in share of looks against SS26, across the fashion weeks analyzed so far.
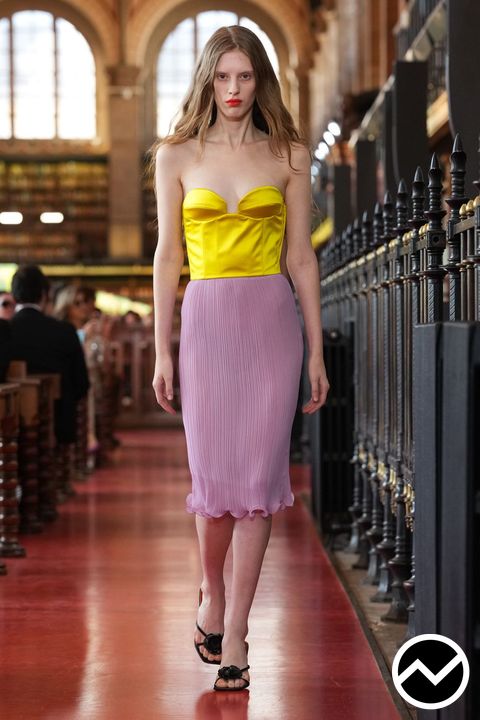
Straight Skirts
10.3% of looks · +5.2 pts
SS27 womenswear

Sleeveless Top
14.9% of looks · +6.1 pts
Milan womenswear
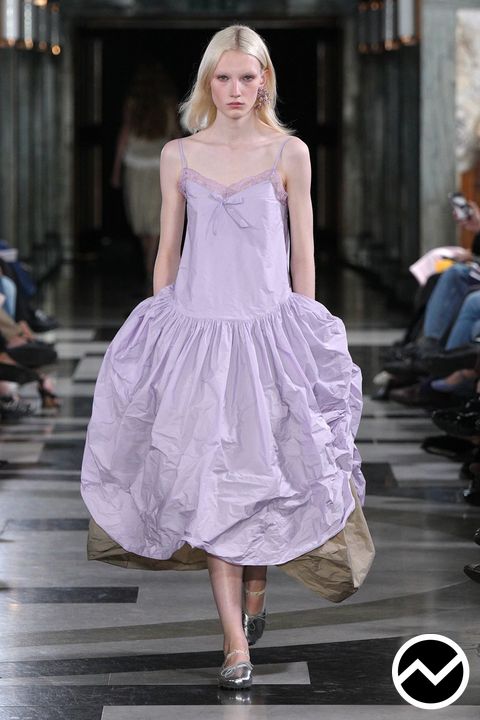
Dropped Dress
8.2% of looks · +7.2 pts
London womenswear
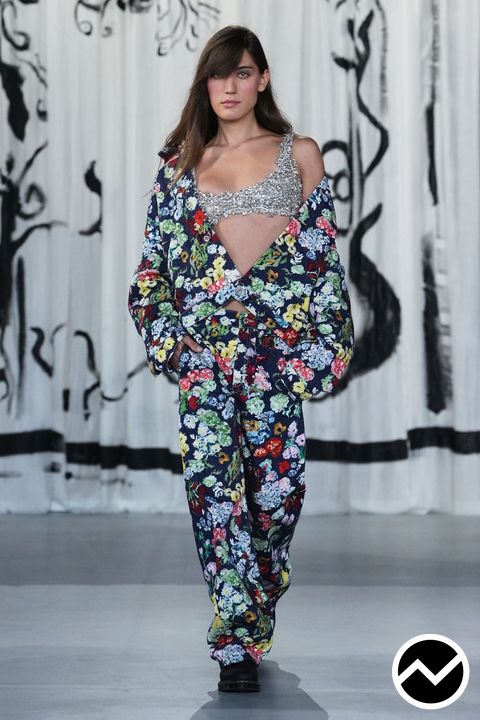
Floral
19.1% of looks · +7.8 pts
Copenhagen womenswear
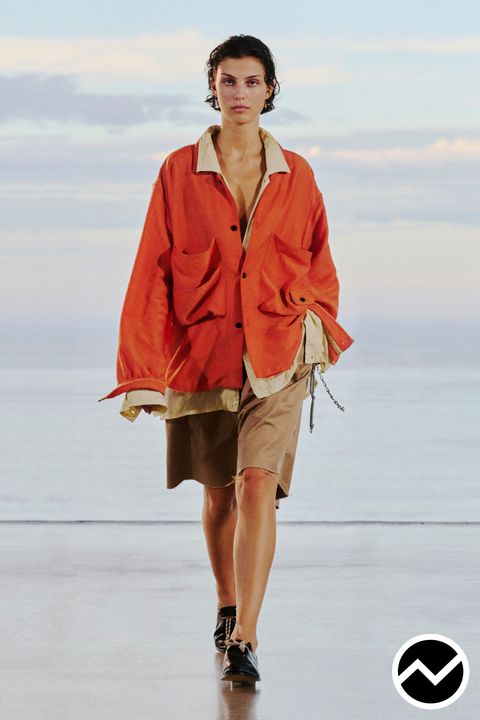
Drop Shoulder Jacket
11.3% of looks · +9.4 pts
Tokyo womenswear
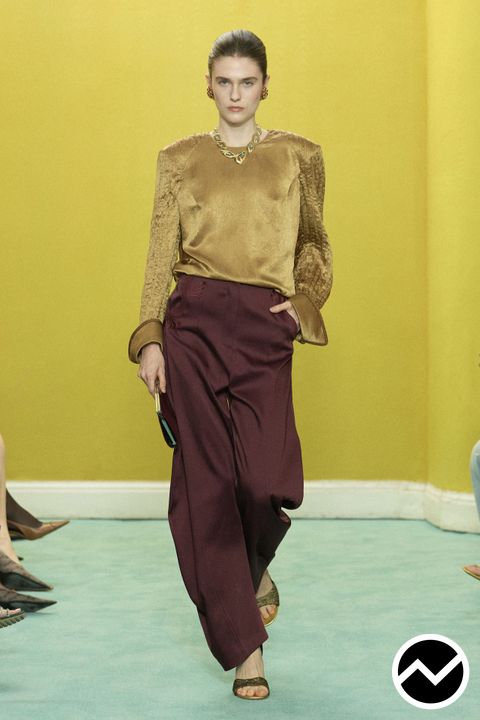
Satin
42.2% of looks · +18.9 pts
Shanghai womenswear
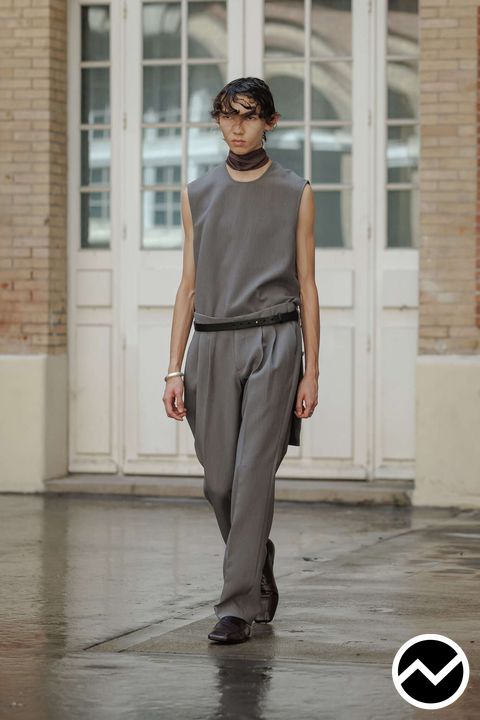
Minimalist
23.9% of looks · +9.0 pts
Paris menswear

High-Rise Pants
20.2% of looks · +10.3 pts
Milan menswear
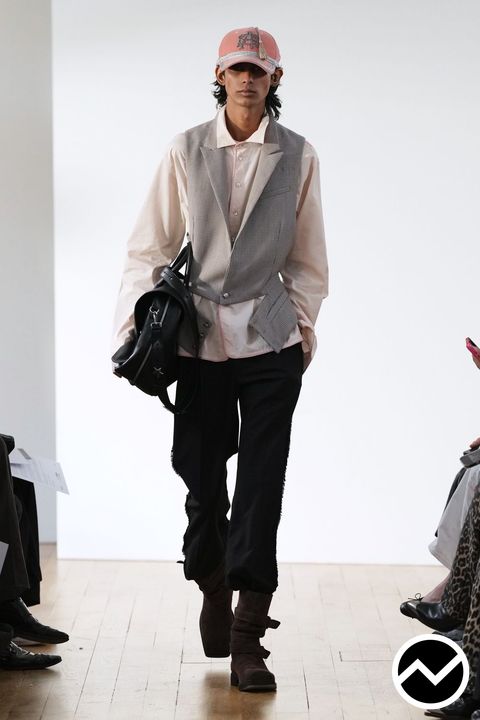
Hip Length Shirts
27.1% of looks · +12.8 pts
London menswear
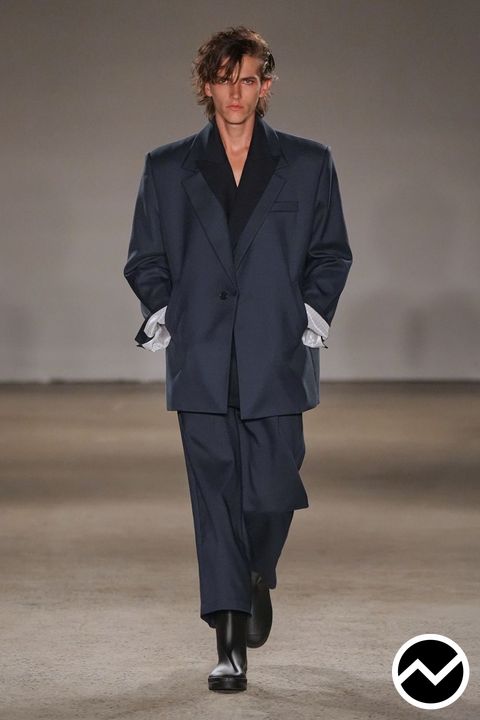
Androgynous
29.7% of looks · +14.3 pts
New York menswear
How the numbers work
- Trend
- A key item, theme, color, pattern or fabric that T-Fashion tags on each look.
- Share of looks
- Looks that carry the trend, divided by all looks of the same season, gender and fashion week scope.
- Change
- The share of looks this season minus the share in the same season one year earlier, in percentage points.
- Rising and fading
- Rising means the share grew by 10% or more on the year. Fading means it fell by 10% or more. New means no comparable data from the year before.
- Designers
- The number of brands that showed the trend in at least one look.
The full runway, in T-Fashion
| On this page | In T-Fashion |
|---|---|
| Share of looks and change for each trend | Every look behind each number, by designer, city and color |
| Top trends per fashion week | Every trend, with rising, most seen and fading rankings |
| Snapshot as of the last update | Updated as each show is analyzed |
| – | Moodboards, concepts and tech packs from the same looks |
Already a customer? Open this in T-Fashion
Book a demo
Tell us a little about you, then pick a time on the next step.
Questions
- What is on the runway pages?
- One page per trend and scope: a key item, theme, color, pattern or fabric at one season, gender and fashion week. Each page gives the share of looks, the change against the same season a year earlier, the designers behind it, what it was worn with and a sample of runway photos.
- How is share of looks measured?
- T-Fashion tags every look of every show. The share of looks is the number of looks that carry the trend divided by all looks in the scope. The change compares it with the same season one year earlier.
- When are new fashion weeks added?
- Each fashion week appears once T-Fashion editors mark it live, usually while the season is still running. The all-cities view appears when every fashion week of the season is in.
- Can I quote the numbers?
- Yes, with a link to the page. Every page ends with a citation line and has a markdown version. Definitions are on the methodology page.